

Catching a failing server before it goes down, not after
Machine-learning anomaly detection across a national government platform's infrastructure
2024
Ongoing engagement
Public Sector / Infrastructure
Starting position
Starting position
- None
Way to detect an at-risk server before it fails
Issues surfaced only after an outage was already affecting the platform
- Fragmented
Centralized visibility across production clusters
Metrics and logs scattered across separate tools per cluster
- None
Automated anomaly detection on infrastructure metrics
Thresholds set manually, if at all, with no learned baseline
- Manual
Index lifecycle management for high-volume logs
Log retention and storage costs managed ad hoc
Market size
Dozens of production servers across multiple Elasticsearch clusters supporting a national digital government platform
Production infrastructure monitored through the platform
Approx. budget
50,000 – 199,999 €
Budget breakdown
Budget bucket per Clutch.co project cost category. Exact figures under NDA.
Ongoing engagement
Ongoing
- 1
Phase 1
Discovery and cluster/index architecture across environments
- 2
Phase 2
Infrastructure as code (Terraform/Terragrunt) for Elastic configuration
- 3
Phase 3
ML anomaly detection jobs and alerting on infrastructure and application logs
- 4
Phase 4
Ongoing operations: dashboards, index lifecycle, multi-environment rollout
A national platform's infrastructure had no early-warning system
A national digital government platform runs multiple production Elasticsearch clusters and dozens of servers across environments. Issues in CPU, memory, disk or network behaviour typically surfaced only once they were already affecting the platform, with no automated way to catch abnormal patterns early.
No automated way to detect an at-risk server before it actually failed
Metrics and logs fragmented across clusters and environments, with no unified view
No learned baseline for normal behaviour, so anomalies had to be caught by manual review
High-volume infrastructure and application logs needed lifecycle management to control storage costs at national scale
Machine-learning anomaly detection across the whole infrastructure
We built and manage the Elastic Stack observability layer as infrastructure-as-code, with ML-based anomaly detection continuously comparing live server, network and application behaviour against a learned baseline - surfacing unusual patterns before they become outages.
Infrastructure as code
Elasticsearch and Kibana configuration - index templates, lifecycle policies, roles, dashboards - managed and versioned through Terraform and Terragrunt.
ML-based anomaly detection
Elastic ML jobs continuously score infrastructure and application metrics against a learned baseline, flagging deviations by severity.
Unified observability dashboards
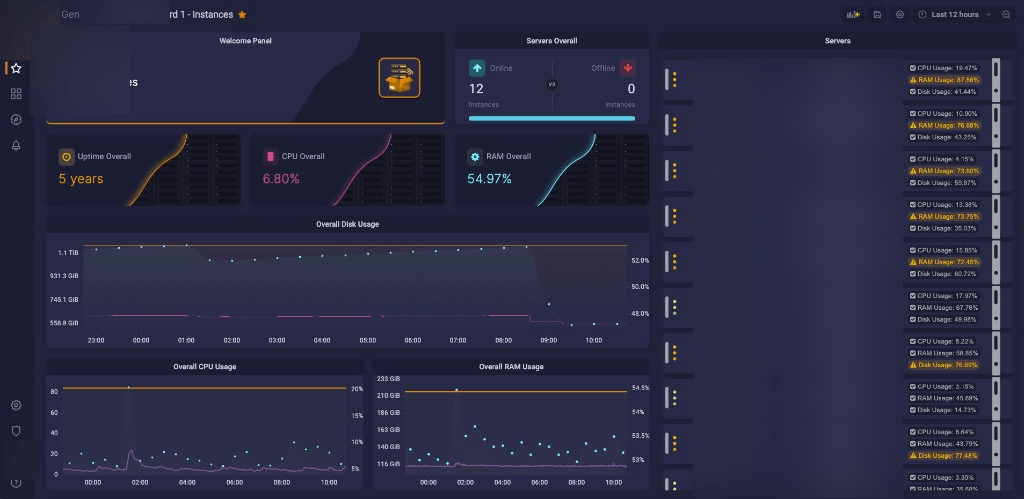
Uptime, CPU, RAM and disk usage across every server, visible in one place, per environment.
Index lifecycle management
Automated hot/warm/cold/delete policies keep high-volume logs cost-efficient without manual cleanup.
Multi-environment rollout
The same observability stack runs consistently across demo, stage, UAT and production.
How infrastructure monitoring changed
Monitoring moved from reactive, per-cluster checking into one proactive, ML-driven observability layer covering the whole platform.
Detecting infrastructure issues
Before
Reactive, after impact
After
Proactive, via ML anomaly scoring
Unusual behaviour is flagged before it becomes an outage.
Observability across clusters
Before
Fragmented, per cluster
After
Unified dashboards across environments
One place to see server health across the whole platform.
Elastic Stack configuration
Before
Manual changes, per cluster
After
Infrastructure as code, versioned
Every change to index templates, lifecycle policies and roles is reviewed and repeatable.
Log storage management
Before
Manual, ad hoc retention
After
Automated index lifecycle policies
Storage cost scales predictably as log volume grows.
Fewer surprises, on infrastructure that can't afford downtime
Proactive vs. reactive monitoring
anomalies now surface before impact, not after
Engineering time reclaimed from reactive incident response
estimated time saved by catching anomalies before they escalate into outages
50,000 – 199,999 €
Payback period
Realised through reduced incident response time and fewer reactive escalations
Method
Comparison of reactive, manual monitoring before vs. automated ML-based anomaly detection after
Confidence
Medium - based on operational comparison, not an audited incident report
This is critical national infrastructure - detailed incident and uptime figures are confidential.
Infrastructure issues caught before they become outages
The observability platform is in production, monitoring a national government platform's infrastructure across multiple environments. Live incident figures belong to the client; the figures below describe what changed operationally.
Detecting an at-risk server before failure
Before
Not possible
After
Continuous ML anomaly scoring
In production
Observability across production clusters
Before
Fragmented, per cluster
After
Unified dashboards across environments
Ongoing
Elastic Stack configuration management
Before
Manual, per cluster
After
Infrastructure as code
Since rollout
Log lifecycle management
Before
Manual, ad hoc
After
Automated index lifecycle policies
Ongoing
“We used to find out about a failing server from the complaints, not from the system. Now the anomaly detection flags it first.”
Infrastructure Lead
Confidential