
Business intelligence basics: guide for tech leaders

Many executives believe business intelligence is just about generating reports and dashboards. That’s a costly misconception. True BI transforms raw data into strategic insights that drive operational efficiency and competitive advantage. For technology-forward enterprises, understanding BI fundamentals is essential to making informed decisions, optimizing processes, and staying ahead in rapidly evolving markets. This guide breaks down core BI concepts, methodologies, and practical applications to help you leverage data effectively. You’ll learn how to distinguish BI from business analytics, navigate common implementation pitfalls, and build a data-driven culture that delivers measurable results.
Table of Contents
- Understanding Business Intelligence Fundamentals
- Core Methodologies And Processes In Business Intelligence
- Business Intelligence Versus Business Analytics: Key Differences And Synergy
- Overcoming Common Pitfalls In Implementing Business Intelligence
- Explore Custom BI And AI Solutions With NULLBIT
Key takeaways
| Point | Details |
|---|---|
| BI drives operational decisions | Business intelligence transforms historical data into actionable insights for current operations and strategic planning. |
| Analytics types matter | Descriptive analytics shows what happened, predictive forecasts trends, and prescriptive recommends actions. |
| ETL ensures data quality | Extract, transform, load processes are critical for clean, reliable data that powers accurate BI insights. |
| BI differs from BA | BI focuses on historical reporting while business analytics emphasizes predictive modeling and future scenarios. |
| Strategy before tools | Define KPIs and business objectives first, then select BI platforms that align with your strategic goals. |
Understanding business intelligence fundamentals
Business Intelligence (BI) involves processes to collect, analyze, and report data for informed decisions across your organization. At its core, BI encompasses three analytics types that work together to create comprehensive insights. Descriptive analytics answers what happened by examining historical data patterns and trends. Predictive analytics forecasts what might happen using statistical models and machine learning algorithms. Prescriptive analytics recommends what should be done by evaluating multiple scenarios and outcomes.
These capabilities provide technology enterprises with a significant competitive advantage. When you can quickly identify performance bottlenecks, customer behavior shifts, or market opportunities, you respond faster than competitors relying on intuition alone. BI systems aggregate data from multiple sources into unified dashboards that reveal relationships invisible in isolated reports. This holistic view enables cross-functional teams to align strategies and measure progress against shared objectives.
Common BI applications in tech-forward organizations include:
- Real-time performance monitoring across development teams and product lines
- Customer behavior analysis to optimize user experience and retention strategies
- Resource allocation optimization based on project profitability and capacity planning
- Market trend identification for product roadmap prioritization
- Operational efficiency tracking to reduce costs and improve delivery timelines
The real power emerges when you use AI in business intelligence workflows to automate pattern recognition and anomaly detection. Machine learning models can process millions of data points to surface insights human analysts might miss. This combination of human expertise and algorithmic processing accelerates decision cycles dramatically.
Pro Tip: Focus on actionable insights rather than data accumulation. A dashboard with 50 metrics creates confusion, while five carefully chosen KPIs aligned to business objectives drive clarity and action.
Core methodologies and processes in business intelligence
Successful BI implementation relies on robust data extraction, transformation, and loading processes that ensure information quality. ETL extracts raw data from source systems like CRM platforms, ERP databases, and web analytics tools. The transformation phase cleanses data by removing duplicates, standardizing formats, and applying business rules. Finally, loading moves processed data into centralized repositories where analysts can access it efficiently.
ELT represents an alternative approach where raw data loads first, then transforms within the target system. This method works well with cloud data warehouses that offer massive processing power. Modern enterprises often use hybrid approaches, applying some transformations during extraction while deferring complex calculations until analysis time.
Understanding OLTP versus OLAP database architectures is crucial for effective BI design. OLTP systems handle transactional workloads with frequent inserts, updates, and deletes optimized for operational efficiency. OLAP databases support analytical queries across large datasets, prioritizing read performance over write speed. Your BI tools typically query OLAP systems to avoid impacting production operations.

Data warehouse schemas organize information for optimal query performance:
| Schema Type | Structure | Best For |
|---|---|---|
| Star | Central fact table with dimension tables | Simple queries and fast performance |
| Snowflake | Normalized dimensions with subtables | Reduced storage and data integrity |
| 3NF | Fully normalized relational design | Complex relationships and flexibility |
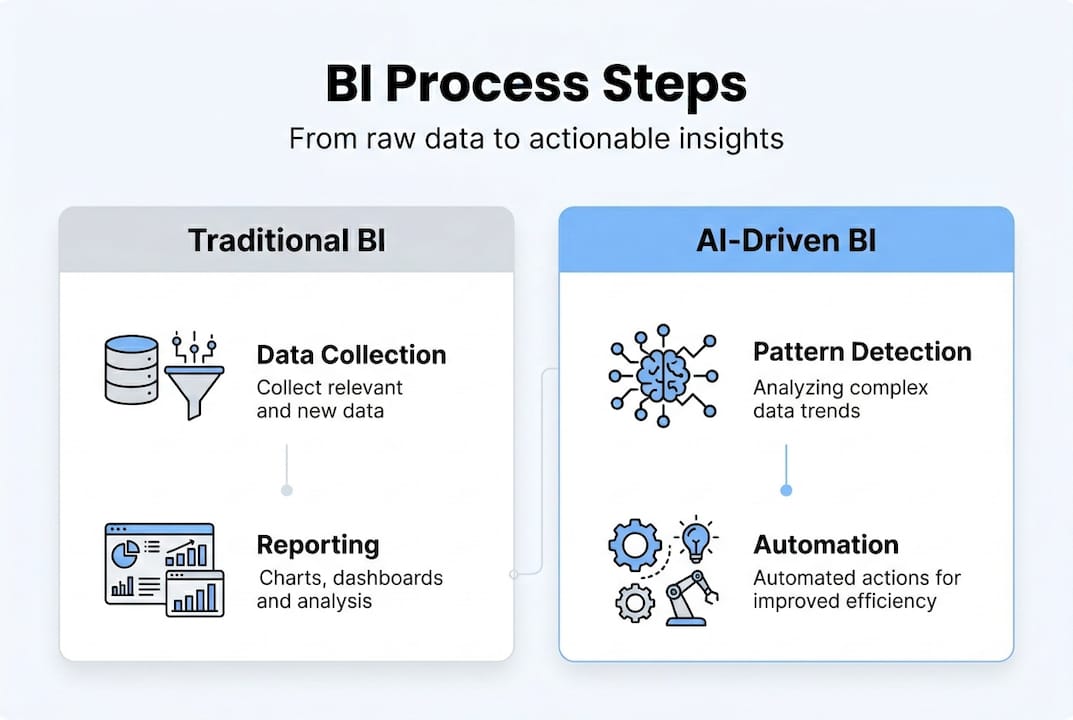
The complete BI process follows five essential steps that transform raw data into business value. First, identify which data sources contain information relevant to your business questions. Second, gather and clean that data to ensure accuracy and consistency. Third, analyze the prepared data using statistical methods and visualization techniques. Fourth, create dashboards and reports that communicate insights clearly to stakeholders. Fifth, take informed actions based on those insights and measure outcomes.
This cyclical process requires continuous refinement. As you implement AI workflow enterprise solutions, feedback loops help you identify which metrics drive the most value. You’ll discover that some KPIs initially seemed important but don’t correlate with business outcomes, while unexpected data points reveal critical patterns.
Pro Tip: Invest heavily in data quality during the ETL stage rather than trying to fix problems downstream. Clean source data prevents cascading errors that undermine trust in your BI outputs and waste analyst time on validation instead of insight generation.
Business intelligence versus business analytics: key differences and synergy
BI focuses on descriptive and historical analytics that answer what happened in your operations. You examine past performance, identify trends, and monitor current state through dashboards and reports. This backward-looking perspective provides essential context for understanding business health and tracking progress against goals. BI tools excel at aggregating data from multiple systems into unified views that reveal patterns across departments and time periods.
Business analytics takes a forward-looking approach using predictive and prescriptive techniques to address why events occurred and what might happen next. BA applies statistical modeling, machine learning, and simulation to forecast outcomes and recommend optimal actions. While BI tells you that sales dropped 15% last quarter, BA models explain which factors drove that decline and predicts next quarter’s performance under different scenarios.
| Aspect | Business Intelligence | Business Analytics |
|---|---|---|
| Primary Focus | Historical reporting and current state monitoring | Predictive modeling and future scenario planning |
| Key Questions | What happened? When did it occur? | Why did it happen? What will happen? |
| Common Techniques | SQL queries, dashboards, OLAP cubes | Machine learning, statistical analysis, optimization |
| Business Impact | Operational efficiency and performance tracking | Strategic planning and competitive positioning |
| User Base | Managers and operational teams | Data scientists and strategic planners |
The most sophisticated organizations combine BI and BA into integrated decision-making frameworks. Your digital business DNA should include both capabilities working in concert. BI provides the factual foundation and performance context, while BA generates predictive insights and recommendations. This combination enables you to understand current reality while preparing for multiple future scenarios.
Practical examples demonstrate this synergy in action. A tech company uses BI dashboards to monitor daily active users, session duration, and feature adoption rates. BA models analyze those patterns to predict churn risk, identify high-value customer segments, and recommend personalized engagement strategies. The BI layer ensures everyone sees the same factual baseline, while BA empowers specialized teams to extract deeper strategic value.
When you integrate AI mid-sized firms efficiency initiatives, the BI and BA distinction becomes less rigid. Modern platforms blur these boundaries by embedding predictive capabilities directly into reporting interfaces. A sales dashboard might display historical revenue alongside AI-generated forecasts and recommended actions, giving managers both retrospective and prospective views in one interface.
Overcoming common pitfalls in implementing business intelligence
Poor data modeling represents the most frequent BI failure that undermines system performance and user adoption. When dimension tables lack proper relationships or fact tables contain redundant data, queries run slowly and produce inconsistent results. Users lose confidence when the same metric shows different values depending on how they slice the data. Invest time upfront designing clean star or snowflake schemas that reflect your actual business processes.
Excessive dashboards and visualizations create cognitive overload rather than clarity. Organizations often build separate reports for each department without considering information overlap or strategic alignment. This proliferation leads to conflicting metrics, duplicated effort, and confusion about which numbers are authoritative. Establish governance processes that review new dashboard requests against existing capabilities and business objectives.
Common implementation challenges include:
- Lack of source control for BI artifacts, making it impossible to track changes or roll back errors
- Data silos where departments maintain separate systems that can’t communicate effectively
- Scalability problems when initial designs can’t handle growing data volumes or user counts
- Inadequate security models that expose sensitive information or restrict access too broadly
- Missing documentation that leaves future maintainers guessing about calculation logic and data lineage
These pitfalls directly impact BI effectiveness and organizational trust. When dashboards load slowly or show outdated information, decision-makers revert to spreadsheets and gut instinct. When different reports contradict each other, political battles erupt over whose numbers are correct. The resulting skepticism can take years to overcome, even after technical issues are resolved.
Best practices emphasize strategy and KPIs before technology selection. Define what business questions you need to answer, which metrics indicate success, and how decisions will change based on insights. Only then should you evaluate platforms and tools that support those requirements. Too many implementations start with tool selection, then struggle to fit business needs into predetermined technical constraints.
Data quality and governance matter more than sophisticated analytics capabilities. A simple report built on accurate, timely data delivers more value than advanced machine learning models trained on flawed information. Establish clear data ownership, validation rules, and update schedules. Create processes for handling exceptions and resolving discrepancies before they propagate through your BI ecosystem.
Focus on business-led BI implementation to drive adoption and ensure solutions address real operational needs rather than showcasing technical capabilities. When business stakeholders own the requirements and success criteria, they become champions who drive usage across their teams.
Your business DNA should include BI governance as a core competency, not an afterthought. Assign executive sponsors who hold teams accountable for data quality and insight utilization. Build feedback mechanisms that capture user experience and continuously refine your BI capabilities based on actual usage patterns and business outcomes.
Explore custom BI and AI solutions with NULLBIT
Transforming BI concepts into operational reality requires expert technology partners who understand both data architecture and business strategy. NULLBIT delivers custom software development services tailored to your specific BI requirements, whether you need data warehouse design, ETL pipeline development, or dashboard creation. Our team builds scalable solutions that grow with your data volumes and analytical complexity.
Integrating AI solutions into your BI infrastructure unlocks predictive and prescriptive capabilities that move beyond historical reporting. We implement machine learning models, natural language processing for conversational analytics, and automated insight generation that surfaces anomalies and opportunities proactively. Our agile approach ensures flexible development cycles that adapt to evolving business needs and incorporate user feedback continuously. Partner with NULLBIT to accelerate your data-driven transformation and achieve measurable operational efficiency gains.
FAQ
What is the difference between business intelligence and business analytics?
Business intelligence focuses on descriptive analytics that examine historical data to understand what happened in your operations. BI tools generate reports, dashboards, and visualizations that track performance metrics and identify trends over time. Business analytics emphasizes predictive and prescriptive techniques that forecast future outcomes and recommend optimal actions. BA applies statistical modeling and machine learning to answer why events occurred and what you should do next.
Why is data quality essential for business intelligence success?
Data quality directly determines the accuracy and reliability of insights that drive business decisions. When source data contains errors, duplicates, or inconsistencies, those flaws propagate through your entire BI system and produce misleading conclusions. Poor data quality erodes stakeholder trust, causing decision-makers to abandon BI tools in favor of intuition or manual spreadsheets. Investing in data validation, cleansing, and governance processes ensures your BI outputs reflect true business reality and support confident action.
What are common challenges when implementing business intelligence tools?
Organizations frequently struggle with poor data modeling that creates performance bottlenecks and inconsistent metrics across reports. Excessive dashboards overwhelm users with too many visualizations, making it difficult to identify actionable insights. Data silos prevent integration across departments, limiting the holistic view that makes BI valuable. Scalability issues emerge when initial designs can’t handle growing data volumes or user counts. Strategic planning, clear governance, and focus on business objectives rather than technical features help overcome these obstacles and drive successful adoption.
How can technology-forward enterprises maximize the benefits of business intelligence?
Prioritize defining KPIs and strategic objectives before selecting BI platforms or building dashboards. This business-first approach ensures your BI investments address real operational needs rather than showcasing technical capabilities. Combine BI historical reporting with business analytics predictive modeling to gain comprehensive insights that inform both tactical and strategic decisions. Integrate AI solutions that automate pattern recognition and surface anomalies proactively. Establish strong data governance and quality processes that maintain stakeholder trust in your BI outputs over time.